CallRail Intake & Call Quality Report
CallRail intake and operational views, with Lead Docket attribution from matched calls (phone + time proximity to actual signed cases) where data/callrail_enriched.json is present.
Executive Snapshot
Top Sources Producing Signed Cases
| Source | Calls | Strict Matches | 24hr Matches | Signed Cases |
|---|
Matched calls based on phone + time proximity to actual signed cases.
Verified Call → Case Examples
These are real matched calls tied to signed cases. Spot check these to validate attribution.
| Call start time | Customer phone | Source | Duration | Match type | Match Δ (min) | Lead status | Case type |
|---|
Data Window
Date range analyzed: Not available
Total calls: Not available
Calls with transcripts: Not available
Method: CallRail call data. Signed attribution uses data/callrail_enriched.json (phone + time proximity to Lead Docket). Other lead estimates use transcript coverage where available.
Transcript-based rows only cover calls with transcripts, so some counts may not match CallRail views exactly.
Prior month performance
CallRail totals for the prior calendar month, when reconciled. Otherwise left blank on purpose.
| Metric | Value |
|---|
Current month performance
This period’s CallRail call totals. When data/callrail_enriched.json is built from Lead Docket, totals show matched leads and signed cases; otherwise transcript-based lead signals from the intel build.
| Metric | Value |
|---|
March produced both higher call volume and a higher transcript-based lead signal rate than February. That suggests volume increased without obvious deterioration in lead quality.
Month vs Month Change
Compares this period to the prior period. If the prior month is partial, comparisons are directional only.
This section compares February and March call volume and transcript-based lead signals.
| Metric | Prior | Current | Change | % change |
|---|
Source Breakdown
Where calls came from. With Lead Docket enrichment, tables add leads, signed cases, and conversion (signed / calls) by CallRail source.
| Source | February Calls | February Lead Signal Rate | March Calls | March Potential Lead Signals | March Lead Signal Rate | Change in Lead Signal Rate | Change in Call Volume |
|---|
| Source | Prior raw | Prior potential lead signals | Current raw | Current potential lead signals | Lead Signal Rate | % vs prior raw | What we heard in calls |
|---|
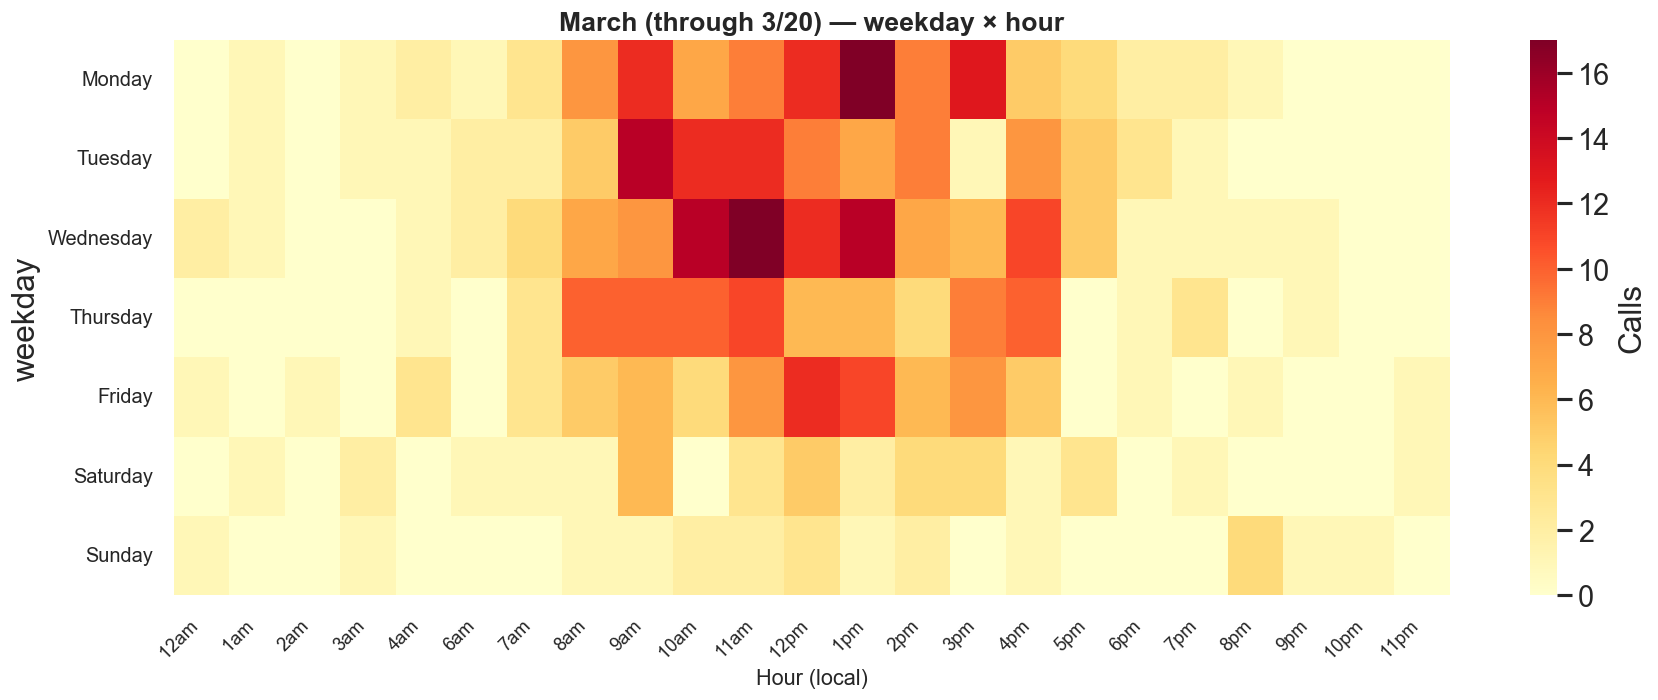
Call Timing Analysis
When calls happen and when quality is highest.
Legend: bars = call volume, line = lead signal rate.
Not available
Call quality breakdown
These categories are based primarily on transcript review and are directional, not final case classifications. They may undercount items better captured by manual tags.
| Call type | Prior | Current | % vs prior |
|---|
Potential missed opportunities
Not available
Volume funnel (current month)
Based on analyzed calls with transcripts. This view shows where call volume is concentrated.
Transcript subset volume shape
Duration distribution (current month)
Based on analyzed calls with transcripts: call length grouped into practical time buckets.
Duration (seconds)
Heatmap